Weekly spetickism #7
We finish the week with energy, Is Buffett trying to tell us something?, The U.S. can't get enough juice, COVID 2.0? No thanks!, Parents fighting back, & our favorite Climate-Change
A Game-Changer for Shale: New Methane-to-Methanol Catalyst
Hold onto your hard hats, shale enthusiasts. The team at Brookhaven National Laboratory has just cracked open a treasure chest of industrial potential with a cutting-edge catalyst that transforms methane into methanol in a single, low-temperature step. That’s right: imagine converting methane to methanol at a temperature so mild it’s like brewing a cup of tea.
This breakthrough isn’t just a scientific triumph; it’s poised to overhaul how we handle stranded natural gas reserves. Forget the costly and hazardous process of liquifying natural gas and shipping it across the globe. Instead, this new catalyst could allow for localized methanol production, slashing transportation risks and costs.
The implications are massive. If this technology scales, it could help cut methane emissions in the oil and gas sector, aligning with broader environmental and energy goals. According to Brookhaven chemist and study co-author Sanjaya Senanayake, deploying this technology on-site could eliminate the need for transporting high-pressure, flammable LNG, making it a game-changer for remote gas fields.
This innovation rests on a secret ingredient: a thin layer of carbon between palladium and cerium oxide. Chemical engineer Juan Jimenez, the lead author of the groundbreaking study published in the Journal of the American Chemical Society, highlights that this "interfacial" carbon is the magic dust driving the reaction.
Methanol, or wood alcohol, isn’t just a scientific curiosity. It’s an alternative fuel with properties similar to ethanol and has potential as a sustainable marine fuel. Despite a rocky history in the 1990s, its current research trajectory points to promising future applications.
But let’s not get ahead of ourselves. While the potential is enormous, it remains to be seen if this one-step conversion can be scaled economically. The U.S. shale sector, which is producing methane at levels far exceeding climate goals, stands to benefit enormously if this technology can reduce emissions. A recent Environmental Defense Fund study revealed that U.S. oil and gas operations are emitting methane at rates about eight times higher than industry pledges, contributing significantly to global warming.
Methane, while less abundant than CO2, is a potent greenhouse gas—so they say, with a warming effect over 80 times greater than CO2 over a 20-year period. The oil and gas industry’s role in this problem is significant, with methane emissions from venting, leakage, and flaring accounting for about 25% of global anthropogenic emissions.
Recent efforts by the U.S. pipeline regulator to tackle methane leaks through new rules could be bolstered by this catalyst technology. If successful, it might just be the breakthrough needed to clean up the shale patch and mitigate its environmental impact.
U.S. Electricity Demand Peaks in July: A Summer High Point
Hold the presses: U.S. electricity demand hit its apex in July, driven by scorching summer temperatures and a surge in air conditioning use. According to Reuters' Gavin Maguire, backed by LSEG data, power generation in the Lower 48 states has climbed 3.4% year-to-date compared to 2023, reaching levels unseen since at least 2021. But after July's peak, power generation and consumption have started to wane in August.
The International Energy Agency (IEA) forecasts that global electricity demand will surge to its highest rate in two decades through 2024 and 2025, driven by economic growth, soaring cooling needs, and the data center boom. In the U.S., a 3% increase in electricity demand is anticipated for 2024, with a further 1.9% rise in 2025, according to the IEA’s July update.
Utilities across the U.S. are adjusting their forecasts upward, preparing for heightened demand and ramping up investments in infrastructure to handle the strain from data centers and AI-driven power needs. The rush to keep pace with escalating peak demand has them scrambling to modernize their systems beyond earlier projections.
Buffett Dumps Bank of America Shares: Is a Financial Storm Brewing?
Warren Buffett’s strategic exit from Bank of America shares is unfolding just as the Federal Reserve gears up for its anticipated interest rate cuts in mid-September. The legendary investor has also slashed his Apple stake by 50% and amassed a staggering cash reserve. At 93, Buffett appears to be positioning himself for a potentially turbulent economic period.
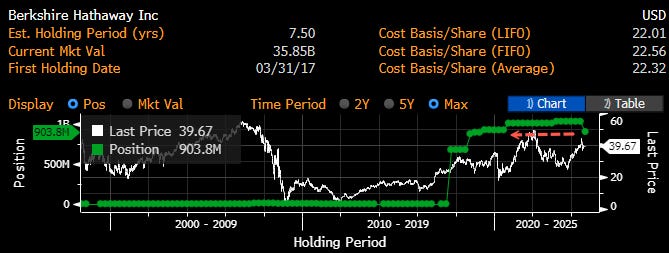
Berkshire Hathaway’s latest moves are nothing short of dramatic. Over the past six weeks, the conglomerate has unloaded nearly 13% of its Bank of America holdings, netting more than $5.4 billion in sales, according to Bloomberg. Just this past week, another $982 million worth of BofA shares were offloaded, leaving Berkshire’s stake at 903.8 million shares, valued around $36 billion—an amount reminiscent of early 2019 levels.
The selling spree began abruptly in mid-July, coinciding with Bank of America’s stock hovering above the $40 mark. The motivation behind this sudden offloading remains murky, but it’s clear that Buffett is reorienting his investment strategy.
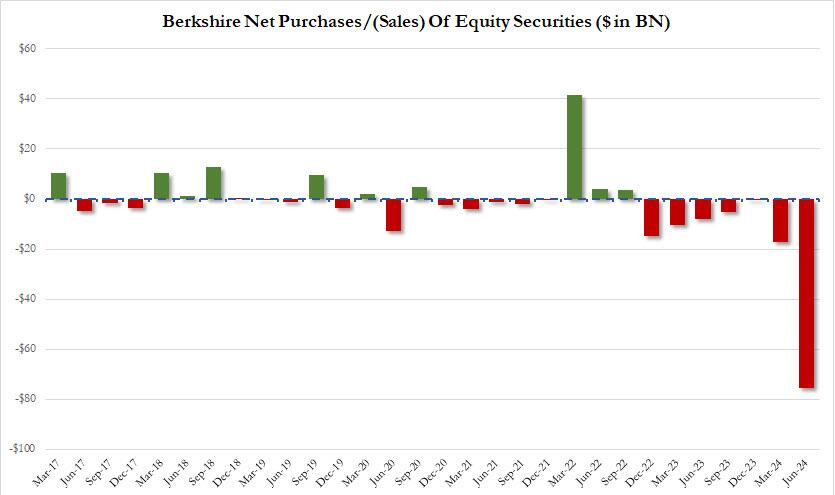
In tandem with the BofA sell-off, Buffett has cut Berkshire’s Apple holdings in half and offloaded other securities, swelling the company’s cash reserves to an unprecedented $277 billion by the end of Q2. This record-breaking cash pile reflects a net $75.5 billion reduction in stock holdings, primarily driven by the liquidation of Apple shares—a move that follows the lackluster response to Apple’s Developer Conference in early June.
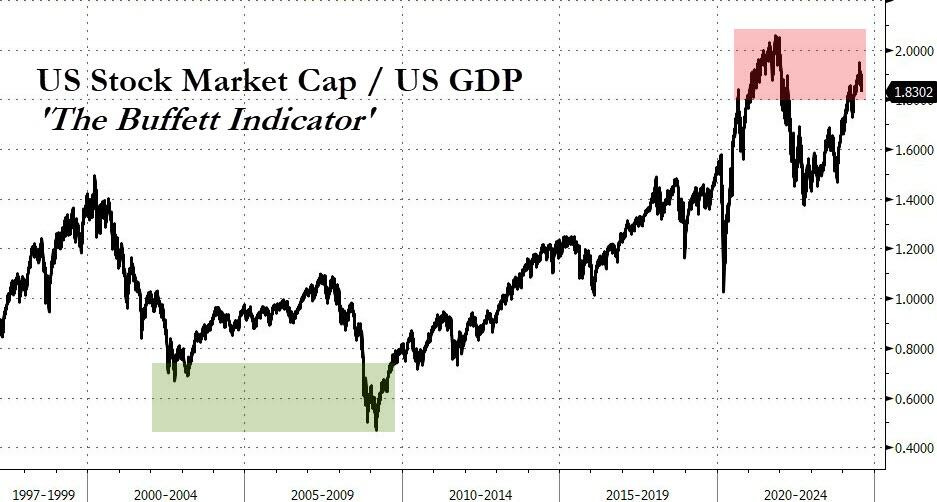
The rationale behind Buffett’s liquidation is becoming clearer: the Buffett Indicator, a gauge of market valuation, suggests that equities are currently overpriced. Additionally, as pointed out by the Wall Street Journal, if the Fed enacts three quarter-point rate cuts this year, Bank of America’s quarterly net interest income could drop by approximately $225 million in Q4 compared to Q2. This potential decline might be a key factor in Buffett’s decision to exit his BofA position.
WHO Unveils Aggressive Strategy to Combat Mpox: A $135 Million Push for What Could Be Covid 2.0
On August 26, the World Health Organization (WHO) rolled out a high-stakes global strategy to combat mpox, previously known as monkeypox. Set to run from September 2024 to February 2025, this initiative is backed by a hefty $135 million and aims to tackle what some are already calling “Covid 2.0.” The plan will focus on strategic vaccinations and a comprehensive outbreak management approach.
Mpox, now under the spotlight for its increased transmissibility due to a new subvariant, has triggered a response reminiscent of early COVID-19 days. The WHO’s strategy includes targeted vaccinations for high-risk groups such as close contacts of recent cases and healthcare workers. The agency is also ramping up surveillance, prevention, research, and equitable access to diagnostics and vaccines, aiming to prevent widespread transmission and engage communities in proactive outbreak control.
Recent developments underscore the urgency of this plan. The Philippines has confirmed two new cases of the milder Clade II variant, bringing the total to three active cases in the country. This follows the WHO's decision to declare mpox a global health emergency earlier this month, echoing the high-alert status seen during the early days of the COVID-19 pandemic. With over 27,000 suspected cases and 1,300 deaths reported in the Democratic Republic of the Congo since January 2023, mpox is proving to be a serious threat.
Despite its less severe symptoms compared to COVID-19, mpox’s potential for rapid spread and the emergence of a more transmissible subvariant have drawn parallels to the early pandemic phase of COVID-19. However, unlike the sweeping lockdowns and restrictions of the COVID era, WHO officials have made it clear that the current response will not involve similar drastic measures. Instead, the emphasis will be on targeted interventions and robust community engagement, with no cases of the more severe Clade I variant reported in the U.S. to date.
As the WHO embarks on this aggressive campaign, the global community is closely watching to see if this approach will effectively manage what some view as the next major infectious challenge—potentially a sequel to COVID-19.
Parents Push Back: Surge in Religious Vaccine Exemptions for Children
As summer fades and students return to classrooms, a striking trend is emerging: more parents are bypassing government-mandated vaccines through religious exemptions. This shift follows the controversial vaccine requirements imposed during the COVID-19 era, highlighting a growing resistance to state-enforced health mandates.
Maryland Matters reports a notable rise in religious vaccine exemptions. Historically, fewer than 2% of kindergartners would opt out, but data shows over 10,000 children have attended school without vaccinations since 2002. This uptick, especially post-COVID, signals increasing vaccine hesitancy driven by politicized debates and misinformation, according to Daniel Salmon from Johns Hopkins Bloomberg School of Public Health.
In Maryland, religious exemptions were minimal in the early 2000s, but rates have steadily climbed. By the 2019-2020 school year, exemptions hit 2.7%, reflecting pre-pandemic concerns. Since then, around 1% of kindergartners each year have used medical exemptions.
The rise in vaccine hesitancy may correlate with an expanding vaccination schedule over the past thirty years. Axios highlights regional variations in non-medical exemptions across the U.S., while former President Donald Trump recently criticized the number of childhood vaccines in a video with Robert F. Kennedy Jr., underscoring the ongoing debate.
As more parents choose to question and refuse government vaccine mandates, the discourse around childhood vaccinations becomes ever more contentious.
Bloomberg's Record Crop Report: The Missing Ingredient
As the 2024/2025 crop year approaches, Bloomberg has unveiled a promising forecast: major crops are set to break records. While the news of record-setting yields for wheat, corn, soybeans, and rice is certainly encouraging, it’s puzzling that Bloomberg’s coverage fails to address a critical factor driving this trend—rising atmospheric CO2 levels.
According to Human Progress, the harvest in 2024-25 will see significant increases: 10% more wheat, 15% more corn, nearly 30% more soybeans, and 10% more rice. Notably, except for corn, all key food commodities will hit all-time production highs. The U.S. Department of Agriculture expects record yields for corn and soybeans, with an average of 183.1 bushels per acre for corn and 53.2 for soybeans. This represents a dramatic increase from two decades ago, when yields were substantially lower.
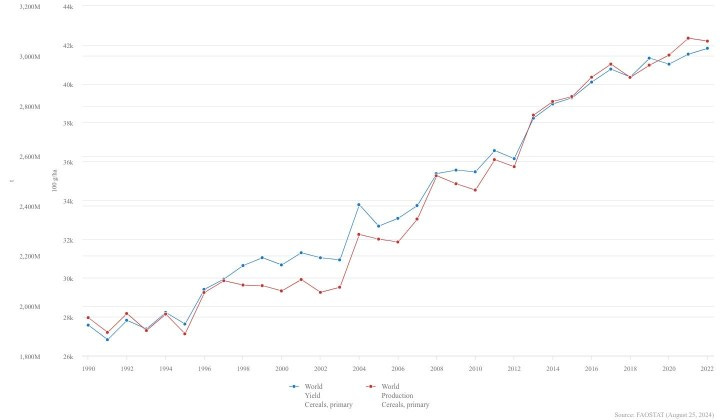
This remarkable surge in crop production is not surprising to those who follow agronomy and botany closely. It aligns perfectly with the long-term trend observed during periods of modest warming and increased atmospheric CO2. The recent data from the U.N. Food and Agriculture Organization (FAO) corroborates this, showing a nearly 52% increase in cereal yields and a 57% rise in cereal production since 1990.
Despite these impressive figures, Bloomberg’s report largely omits the role of rising CO2 levels in this agricultural boon. While the article attributes the crop successes to advancements in irrigation and technology, such as improved combines and tractors, it overlooks the substantial evidence linking higher CO2 concentrations with enhanced plant growth. Higher CO2 levels act as a fertilizer for plants, increasing photosynthesis rates, boosting growth, and improving water-use efficiency.
Research detailed by CO2 Science and NASA supports this view, highlighting that elevated CO2 levels not only enhance crop yields but also reduce water loss through transpiration. Studies, including those published in Environmental Economics and Policy Studies, have demonstrated that increased atmospheric CO2 is a major driver of global greening and crop growth, responsible for approximately 70% of the observed greening effect from 1982 to 2009.
Bloomberg’s omission of this key factor in its coverage raises questions. While it’s refreshing to see positive news about crop production amidst the often alarmist climate narratives, the failure to acknowledge the impact of CO2 and warming on food production is a glaring oversight. The correlation between rising CO2 levels and increased crop yields is well-documented and should be a central part of any discussion on agricultural success.
Sea Temperatures Take a Dive: Alarmist Theories Hit a Cold Front
As summer winds down, a new narrative is emerging in climate circles: ocean temperatures are plunging globally, catching scientists off guard with their rapid decline. After the media’s endless coverage of “boiling oceans” over the past two years—often blamed on everything from sun-seekers in Benidorm to extravagant climate policies—this cooling trend is a stark contrast that’s unlikely to get the same media spotlight.
The media's favorite scare tactic was to frame the oceans as teetering on the brink of disaster, using it as a reliable prop to advance the Net Zero agenda. However, the recent data is anything but alarming for the doom-sayers. Ocean surface temperatures (SST) have dropped significantly, with the current figures showing a marked cooling compared to the record highs of the previous year.
The SST graph, which used to be a fixture in climate reports, now shows a dramatic shift. The temperature curve, which had been on an upward trajectory until April, has since nosedived, currently sitting 0.2°C lower than last year. In the Atlantic, the cooling is even more pronounced. Temperatures have plummeted since May, with the central equatorial region now up to 1°C below average for this time of year. NOAA describes this rapid swing from warm to cold as “remarkable,” noting it’s the fastest such transition ever recorded.
The Atlantic’s cooling isn’t entirely unexpected, as seasonal upwelling—a process where surface waters are replaced by colder, deeper waters—normally occurs. Yet this year, it’s happened alongside a weakening of trade winds that should have led to warmer temperatures. NOAA admits it’s “perplexing” and plans further investigation into these “unusual” atmospheric conditions.
The sudden drop in temperatures contrasts sharply with the usual climate narrative where rising temperatures are almost always attributed to human-induced global warming. Scientists are quick to link warming trends to human activity but seem less equipped to explain natural cooling phases. The over-reliance on complex computer models to predict and understand climate variability often fails to account for natural fluctuations in a chaotic system.
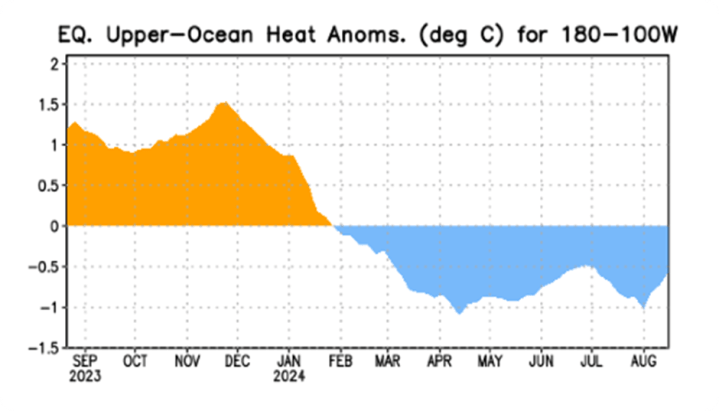
The Pacific has also experienced a cooling trend, following the recent El Niño, a natural climate pattern known for its warming effects. The El Niño’s impact on SSTs, although significant, has now receded, with temperatures in some Pacific regions falling below long-term trends. The sharp drop in SSTs, recorded by NOAA, indicates a return to more typical conditions, countering the recent narrative of persistent warming.
Alarmist claims about unprecedented sea temperature surges, such as those made by the BBC’s Georgina Rannard, now seem misplaced. Rannard’s assertion that scientists were baffled by the recent temperature spikes has swiftly been rendered obsolete by the cooling data. As the El Niño’s effects diminish, so too does the basis for sensational climate alarmism.
In a climate of shifting narratives, this sudden cooling may not fit neatly into the established scare tactics. Expect the media to focus elsewhere as the inconvenient truth of cooling oceans continues to unfold..
Sea Level Rise: A Historical Perspective Shows Today’s Rates are Well Within Natural Bounds
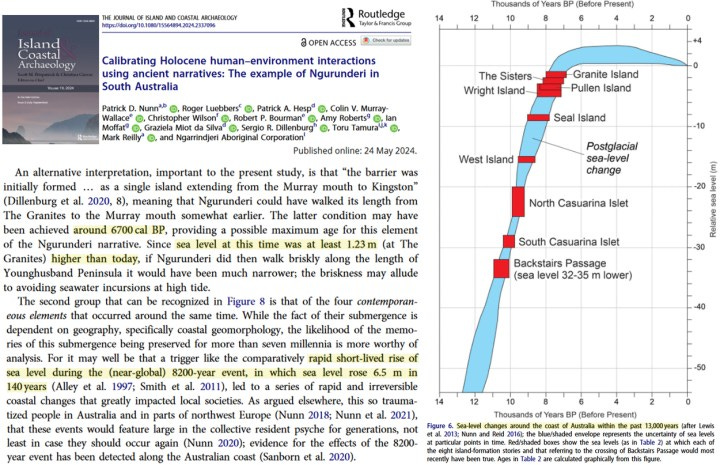
A new study sheds light on a fascinating chapter of Earth’s climate history: 8,200 years ago, sea levels surged by 6.5 meters over just 140 years—a rate of 470 centimeters per century, or 4.7 centimeters per year. This dramatic rise occurred when atmospheric CO2 was a “safe” 260 ppm, illustrating that significant sea level changes have happened long before modern emissions became a point of contention.
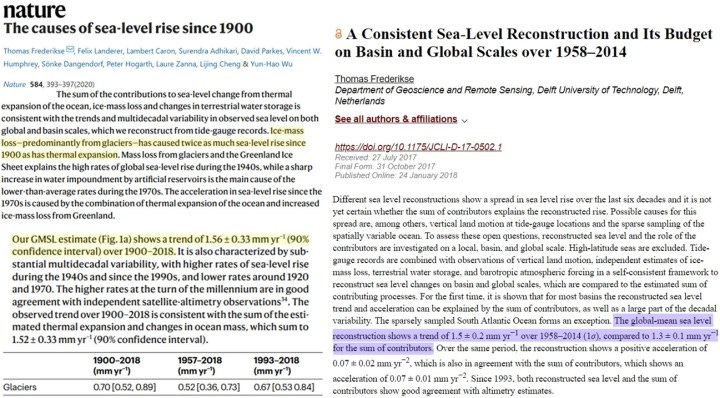
In stark contrast, contemporary sea level rise has been far more gradual. From 1900 to 2018, global sea levels climbed at a mere 1.56 millimeters per year, which translates to about 16 centimeters per century. Narrowing this to recent data, the rate between 1958 and 2014 was 1.5 millimeters annually, equivalent to 0.16 centimeters per year.
The dominant factor in recent sea level changes has been the melt of the Greenland ice sheet (GIS). However, even this has contributed only 1.2 centimeters to sea level rise from 1992 to 2020. In the grand scheme, this is a small fraction compared to historical rates.
Comparing these figures, the natural variability in sea level rise—peaking at 4.7 centimeters per year—is about 30 times greater than the current anthropogenic rate of 0.156 centimeters per year. This context underscores that today’s sea level rise remains well within the bounds of natural variability, despite the climate alarmism often portrayed in the media.
Atlantic Tropics: A Season of Broken Expectations
As the Gulf of Mexico and Caribbean Sea bask in unseasonable warmth, the hurricane season has hit an unexpected lull, just days before its peak. Despite early warnings from climate alarmists about heightened tropical activity due to "climate change," their predictions have yet to materialize.
Meteorologist Ryan Maue weighs in on the perplexing lack of tropical storm activity:
"The Atlantic tropics are completely broken, failing to generate storms despite the so-called 'climate-fueled' ocean temperatures. Our predictive models are floundering, and forecasters are stumped. This is far from normal."
Maue attributes the situation to a mix of factors:
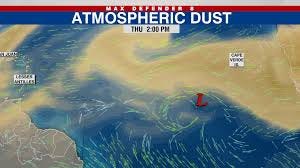
"Saharan dust clouds have contributed to unusually dry and stable air just above the surface, while the circulation from the Northeast Atlantic, influenced by the cold Canary Current, has pushed even more dry air deep into the tropics. This phenomenon hasn't been observed in 50 years."
He also highlights the potential impact of the massive 2022 eruption of the Hunga Tonga-Hunga Ha'apai underwater volcano. The eruption launched vast quantities of soot, water vapor, and sulfur dioxide into the stratosphere, which some suggest could be driving recent warming trends:
"What’s causing this anomaly? The Tonga eruption is a strong candidate, disrupting the Hadley Cell and ITCZ. However, it could also be a novel pattern influenced by a mix of solar activity and unprecedented warming."
Maue adds:
"Keep in mind, the lack of hurricanes isn't entirely inconsistent with climate change models. We might see fewer hurricanes overall, but those that do form could be fueled by climate effects, possibly reaching Category 6+. Right now, the oceans and even the lower stratosphere are dangerously hot."
He concludes:
"My guess is it’s a combination of volcanic activity, solar influences, and the lingering effects of pandemic-induced industrial slowdowns. The Earth has absorbed an excessive amount of shortwave radiation."
John Shewchuk, a certified consulting meteorologist, chimed in on X:
"This pattern was anticipated due to the unprecedented Tonga volcano, which has triggered an unprecedented warming spike. This anomaly is now causing model failures, as these models are calibrated to known air and ocean dynamics. Tonga is introducing unknown effects."
Why do leftist corporate media outlets continue to overlook the Tonga volcano as a potential driver of recent global warming? Likely because it doesn’t fit the narrative that human-produced carbon dioxide is the sole culprit.
Thanks for wrapping up the week with me. Before you dive into your weekend, remember: thinking is the first step to change. Consider joining The Monterey Skeptic to make a difference and shift perspectives. Like and share to spread the word.











Nice summary of various topics.