The Shuffling of the Carbon Musical Chairs
You will die but the carbon will not; its career does not end with you. It will return to the soil, and there a plant may take it up again in time, sending it once more on a cycle of plant and animal
The mid 2000s marked the turning of the old vanguards. Emission in many of the ODEC countries peak and has been on a steady march downward. Emission peak for America in 2005 with 6.14 billion tons, Canada in 2007 with 593.52 million tons, Italy in 2005 with 502.26 million tons, Spain in 2005 with 370.7 million tons, Japan in 2013 with 1.32 billion tons. Other ODEC countries namely France with 538.69 million ton, U.K. 660.39 million ton, and Germany with 1.12 billions emission peak in the 1970s.
Since carbon emission is a side effect of energy production and with energy production tied economic activity which correlated to a higher standard of living, it is reasonable to use carbon emissions as a barometer for economic activity. That is to say a countries ability to access and use cabron has a greater chance of increasing it’s society standard of living than ones that does not. With few exceptions, the opposite also holds true, an economy devoid of carbon will have a lower standard of living for their population.
Many of the OCED countries have may pledges lower their emissions and achieved the “scientific consensus” net zero by 2050. Many have opined there needs to be accelerated efforts to lower carbon emission with aggressive renewable energy standards, tax credits, cap & trade schemes, carbon taxes, & regulations. And while many my think that this prescription is the remedy, the reality is a bite more esoteric so let’s take a look at a few countries America, France, Germany, & the U.K.
There has been no country that has reduced the total production amount of emission more than the United States with roughly 800 million ton, a 7% decrease from 1990 & 20% since 2007, slightly less than total reduction of Spain, Japan, U.K. Italy, Ukraine, Russia, France, Germany, Canada, & Greece combine. The United States production reduction coincided with the shale revolution which unlock large swaths of oil and natural gas. Roughly 60% of America’s production reduction are owed to natural gas. The rest comes from energy efficiency and non-carbon generation.
The U.K. experienced a similar phenomenon. Using natural gas has allow the U.K to have the second largest percentage drop in emission of any country 20%. Natural gas was at the center piece for Germany’s Energiewende, cheap Russian natural gas allowed Germany to build out intermittent energy sources while maintain grid stability. This was made evident by the destruction of the nord stream pipeline which prompted Germany to backtrack on a lot of it’s transitions plans. The return to coal fire generation to the delay of closing their nuclear fleet, all because Germany did not has the access to the low cost natural gas it started with, forcing an increase in emission.
It seems that developed countries have figured out how to decouple economic growth from direct emission growth. The key is natural gas. Simply put, cheap natural gas has allowed developed countries to swap a carbon intense resource, coal, for a less carbon intense one as natural gas has half the CO2 compared to coal. The added flexibility of natural gas being able to be ramped up and down also helps smooth the intermittency of wind and solar allowing a country like Germany to embark on it’s intermittency fantasy. Coupled with energy efficiency regulations—who’s genesis oddly enough began with the energy crisis of the 1970s a force Jevons Paradox—to aid with demand, these combos is and have been the winning receipt for absolute production emission reductions. Locigcally this makes sense as countries become wealthier technology improves which gives them the ability and forces them to find more denser from of energy to avoid entropy. The eonomcy then suffers Jevons paradox—name after English economist William Stanley Jevons—which states:
The Jevons Paradox states that, in the long term, an increase in efficiency in resource use will generate an increase in resource consumption rather than a decrease. Soure https://www.oecd-forum.org/posts/the-jevons-paradox-and-rebound-effect-are-we-implementing-the-right-energy-and-climate-change-policies
The key takeaway to remeber is a country's carbon emissions is the direct result of econocmy activities and each country has incentives to access and use carbon.
The China Syndrome
China’s entrance into the global economy was cemented with it’s accpetance in the World Trade Organization in 2001. China just coming out of Mo’s China economy was followed by the “Architect of Modern China”, Deng Xiaoping. And his reforms would drastically transformative ramifications for China and the World. His reforms opened China up to foreign investments and technology, created special economy zones—Shenzhen—increased private property rights, created a nine-year compulsory education, and creating The 863 program meant to stimulate the development of advanced technologies. Coupled with joining the WTO China now would have access to new trading partners and better rates with current ones, giving China a seat at the table in a globalizing world.
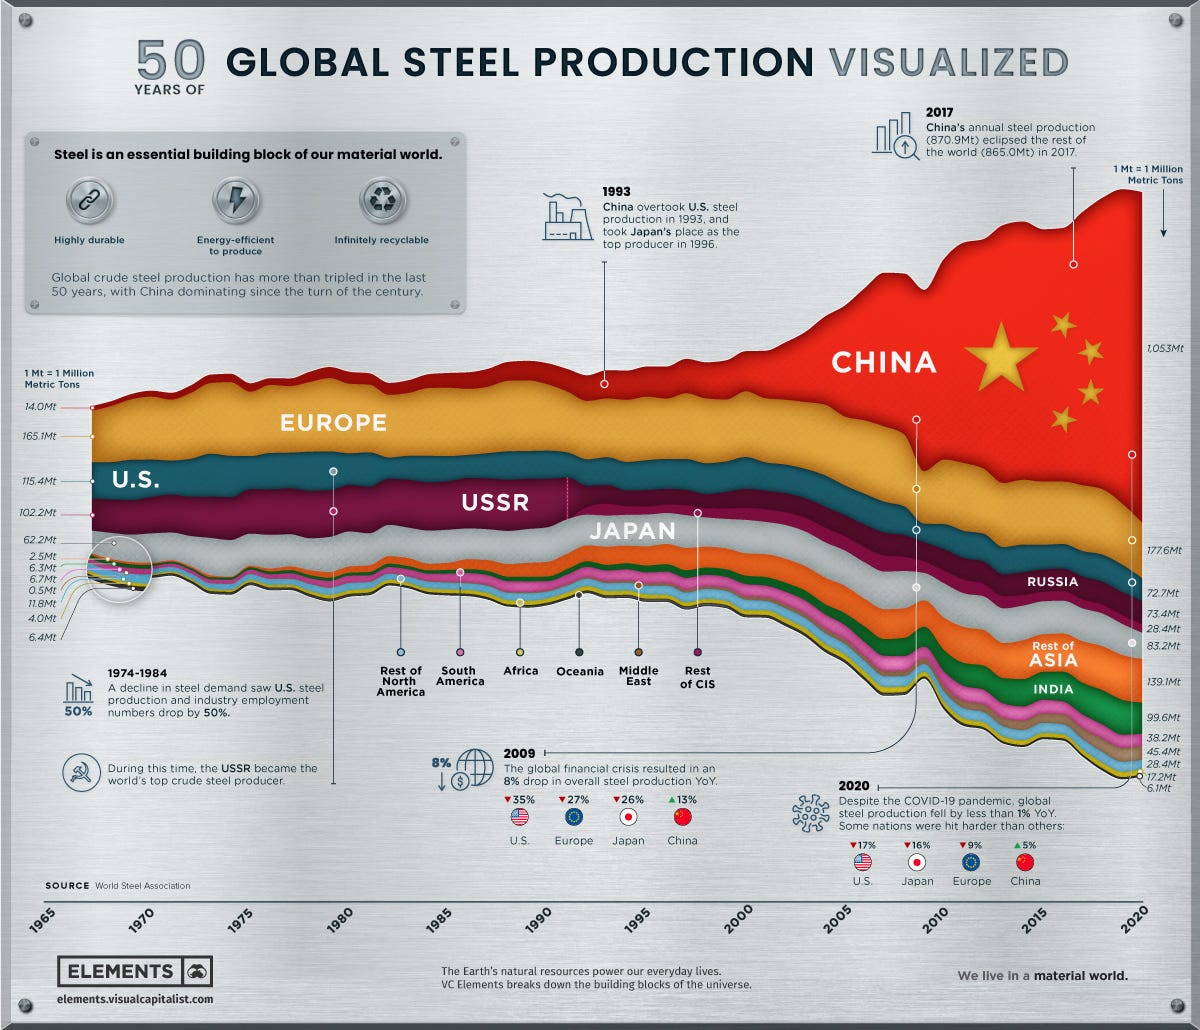
It is however a mistake to believe that these reforms had much impact on the economic success of China as compared to business trends taken hold of at the time as China economic liberalization . The 1970s saw the creation of the E.P.A and with it came enviormental regulation which started to be felt in the 1980s. As a result, American, along with other OCED country, business began "offshoring" and outsourcing manufacturing to low cost countries such as India, Malaysia, Pakistan and Vietnam. No country however benefited more than China. China had a few advantages that other countries did not namely size, population, lax enviormental regulations, and low cost energy—given the country’s huge coal reverses. American and Western companies could arbitrage land, labor, and energy on a scale never seen before. Aided with large state subsidies for certain commodities price strucutre, many energy-intense industries are no located in China.
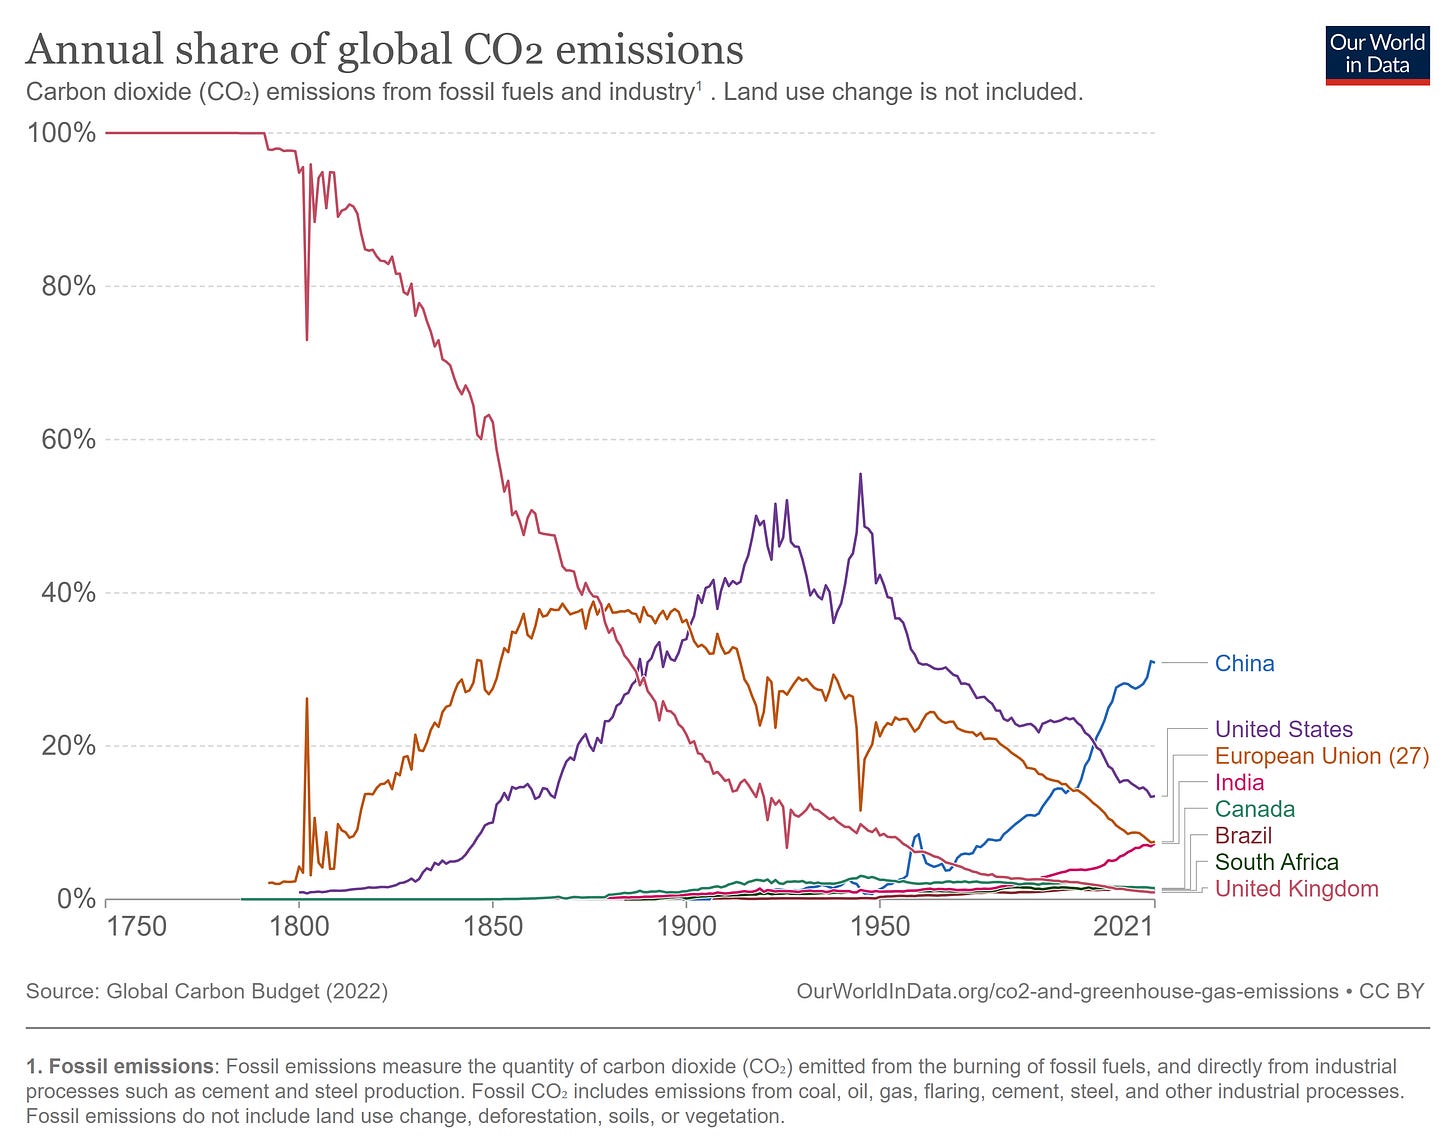
In a sense all that has happen is a shifted from one country’s carbon ledger to another. No different than what took place when the British was responisble for all the carbon in the 1750s until the American Industrial Revolution that began in the 1870s and continued through World War II. With vast swath of land, growing cheap labor workforce, abundance of natural resources, navigable waters, ports, and the lost of European manufacturing after WW2. Looking at the percentage of carbon emission we can get a sense of the energy-intensity nature of a country’s economy. We notice the decline of U.K. emission coincides with a rise in America’s carbon emission and we notice a similar pattern with OCED’s emissions and China!
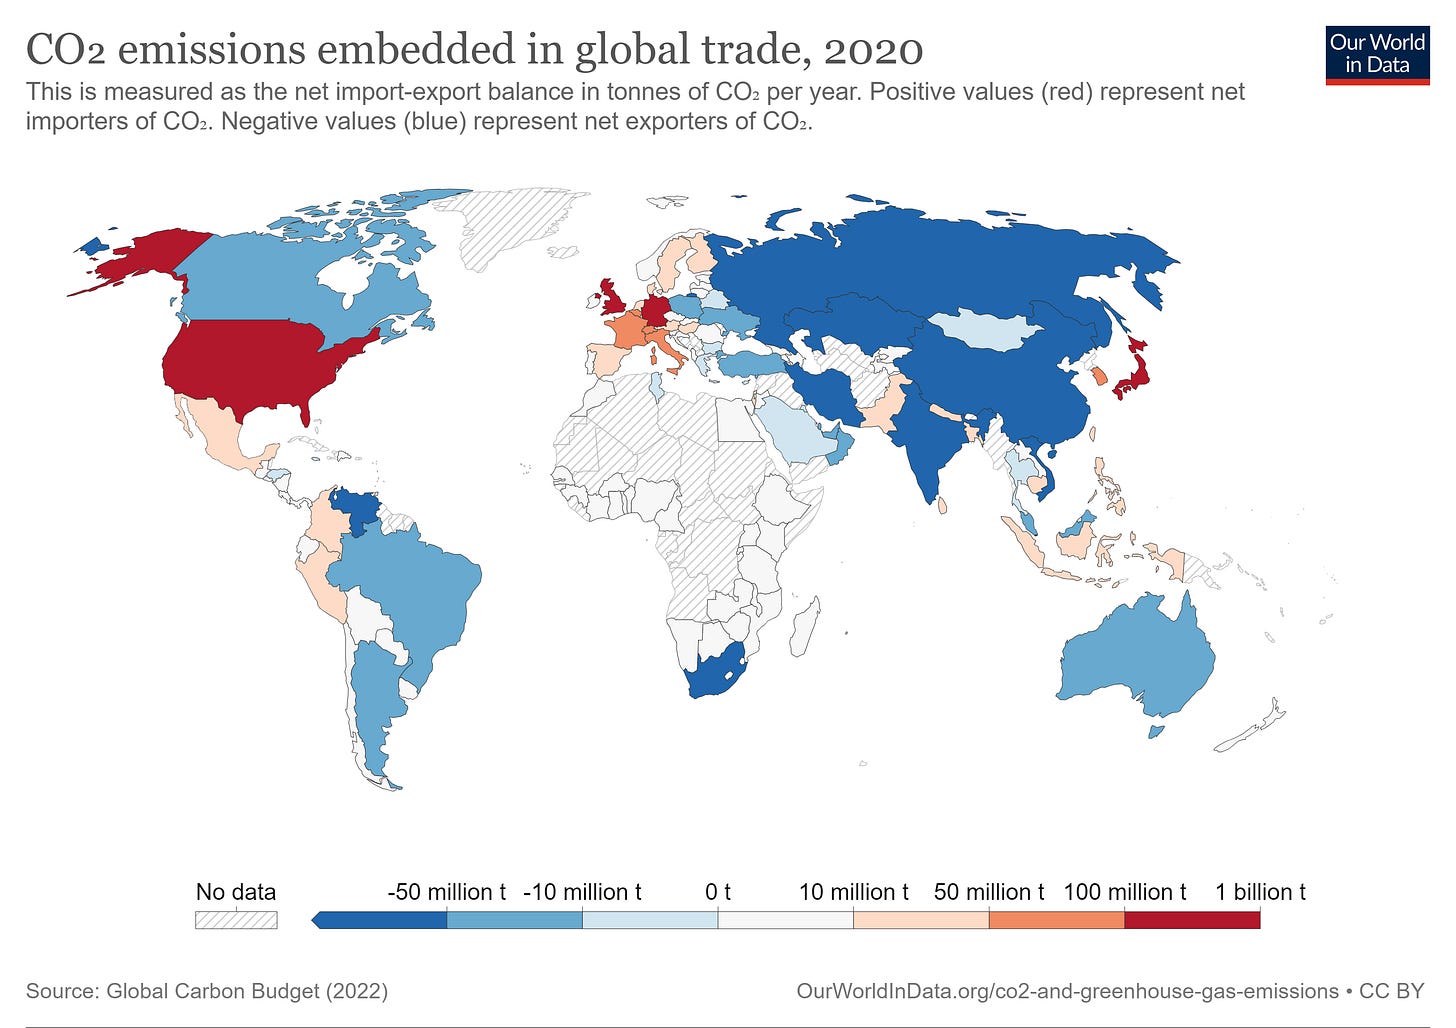
China is now responisble for 27% of all carbon emission with 14.2 billion tons produce annually and with China approving 152 GW of new coal plants, it seems pretty fair to blame China. However one would be mistaken to have this view. In reality, China has become a carbon dumping ground for the OCED! When accounting for trade the emissions picture becomes a lot more clearer. The largest export of China is not vehicle, chips, or even children’s toys, but carbon emission. Every import from China is responbile has madeevery reduction in every OCED possible to date. Every solar panel, wind turbine, battery metal, & E.V.s that are importing to help reduce OCED emission are replace with more carbon intense emissions from China because China’s grid is coal depent and plans to become more coal depent with each passing year. So the more demand for carbon emission the OCED countries are not willing to on-shore the more carbon emission will grow. 2022 saw most carbon emission every, followed 2023 will another recored setting year as will 2024 and beyond all because of musical chairs the OCED countries are playing with their carbon emission.


